Precession Frequency Analysis
This project was done while as a graduate student and then postdoctoral research associate for the Fermilab Muon g − 2 physics experiment. See extensive details in my dissertation. The code base (C++, C, bash) for the project can be found here.
One primary component of the Fermilab Muon g − 2 experiment is the extraction of a specific, so-called, ‘precession’ frequency from large amounts of data, PBs, to high precision (sub-parts-per-million). I was one of the lead analyzers for the first data-taking period of the experiment, and developed associated fitting code. To put it simply, (at the risk of underselling how much work was involved), I fit 1D histograms with non-linear functions, and then conducted many statistical and systematic tests on those fits. I used a unique method called the “Ratio Method,” which helped reduce systematic biases in the final fit results.

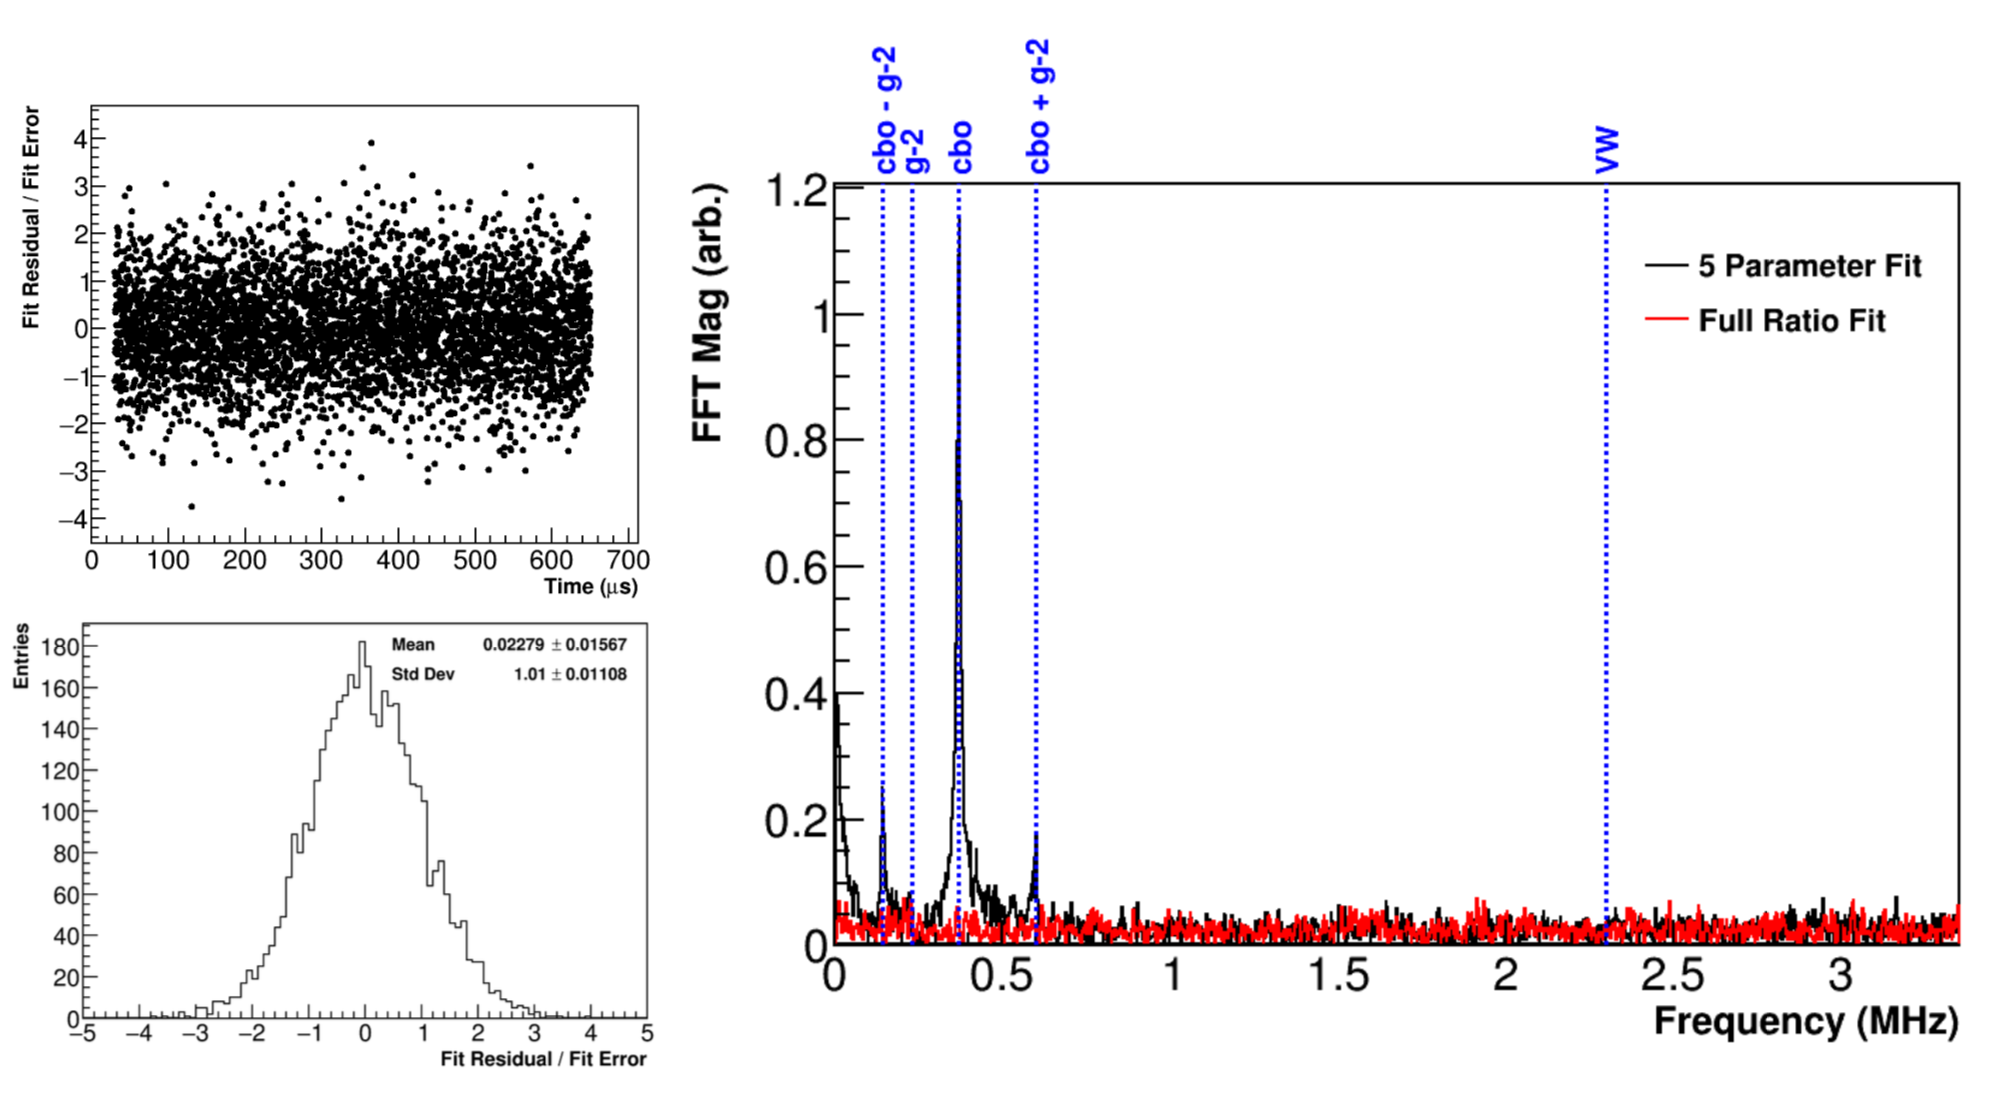
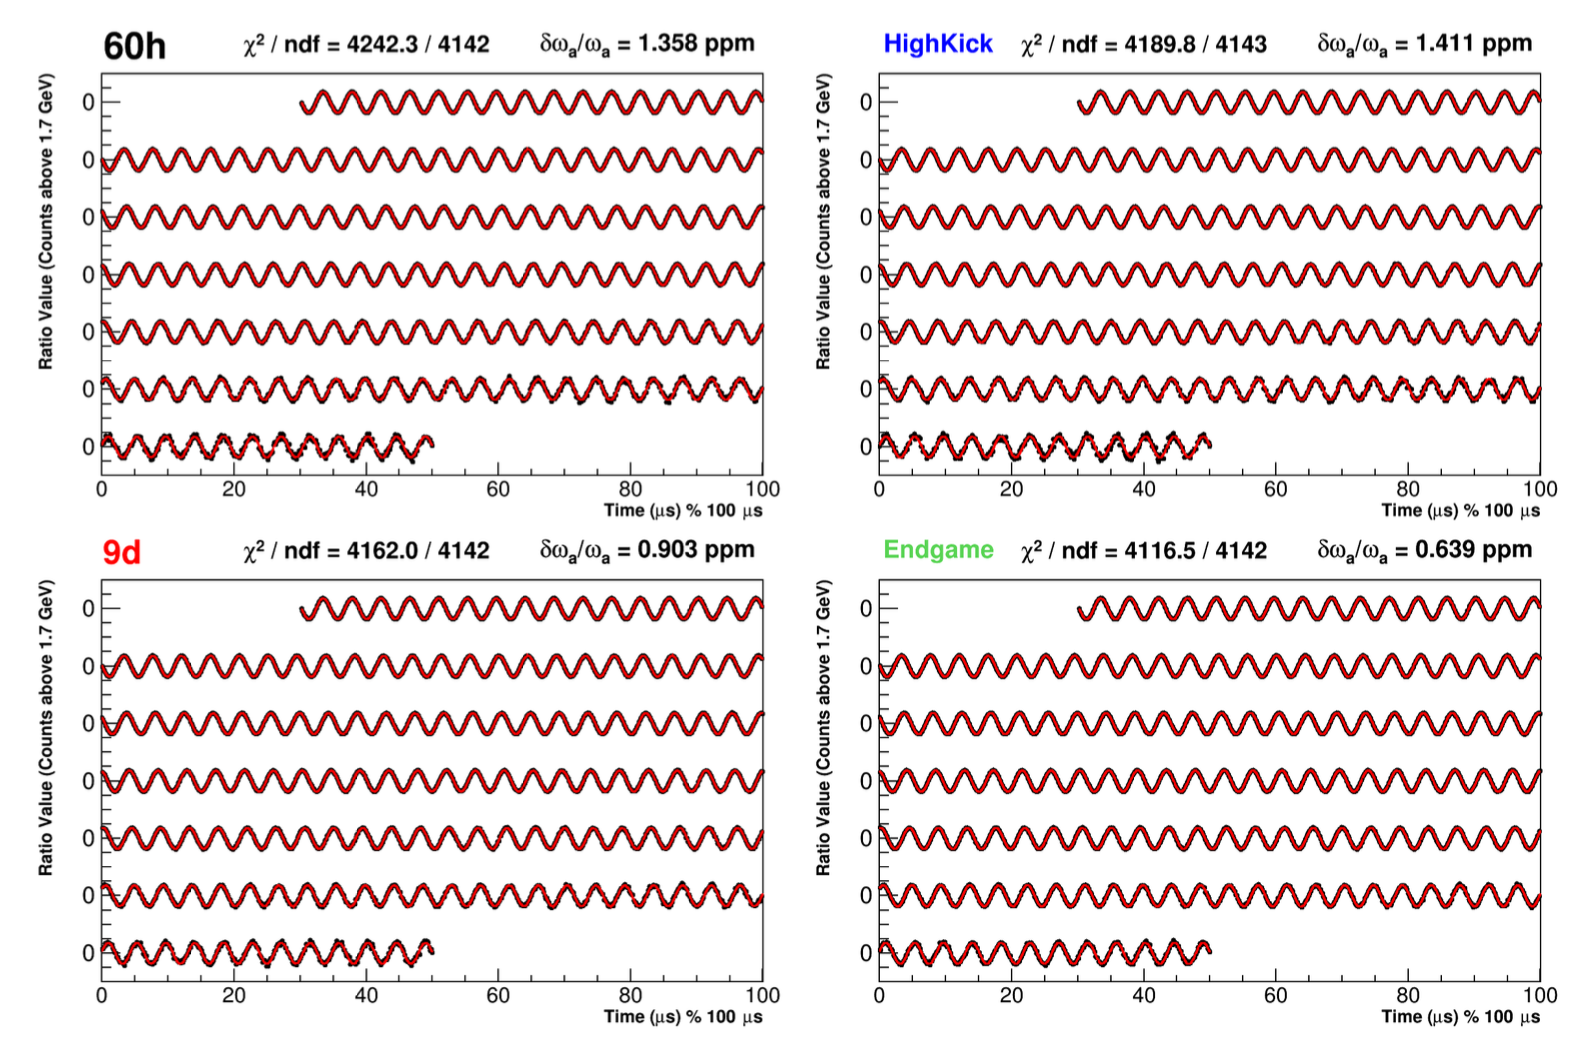
The image above shows fit residuals and the associated fast Fourier transform (FFT) for one of the fits to the data. The most low-level fit contained five parameters, and as shown in the black FFT, left residual peaks indicating effects which were unaccounted for in the fit. The “Full Ratio Fit” in red on the other hand, included 14 fit parameters, and shows via the flat spectrum that all effects were properly accounted for. The image below shows the final (blinded) fits to the four datasets gathered in the first data-taking period of the experiment. The fits are in red and they overlay the data points in black. The precisions on the extracted frequencies are at the parts-per-million (ppm) level or smaller. Chi-squared values are included to show the goodness-of-fits, and each dataset is labeled by the informal moniker used in the experiment.

